The Julia Function, Julia Set, and Julia Fractal, written in Julia
20 Sep 2015This is the "Julia" function
This function iterates from 1 to 200, each iteration setting z (the first parameter of the function) to be z^2 + c, (where c is the second parameter of the function). If at any point z is bigger than 16 or less than -16, we return, with the number of iterations it took to make z that big/small. If it never gets that big/small, return how many iterations we tried before giving up.
function julia(z, c; maxIterations=200) #by default call with 200 iterations.
    for n = 1:maxIterations
        if abs(z) > 16  #if abs(z) is bigger than arbitrary constant
            return n-1; #return the last iteration index
        end
        z = z*z + c;    #z is now increased if z^2 > c
        #complex number arithmetic isn't hard, don't overthink it by trying to understand imaginary numbers!
    end
    return maxIterations; #reached the end, return the last iteration number
end;
Now, build a 2d array, where the first index denotes the x, the second the y, and the value is the color to plot
arr2d[xCoordinate][yCoordinate] == ColorToPlot
iLimit = 1;
rLimit = 1.5;
increment = .002;

# build up a 2d array to plot
# x,y => Color value
arr2d = [
    #julia(z,c) with z=r+i*i(imaginary)  and some imaginary constant c=-.06+.67i
    uint8(julia(complex(r,i), complex(-.06,.67)))
    # for every complex number z:  1.5 + i*1, 1.5 + i*.998... and 1.498 + i*1, 1.496 + i*1
    for i in -iLimit:increment:iLimit,   #for i from -1   to 1   incrementing by .002
        r in -rLimit:increment:rLimit    #for r from -1.5 to 1.5 incrementing by .002
    ];
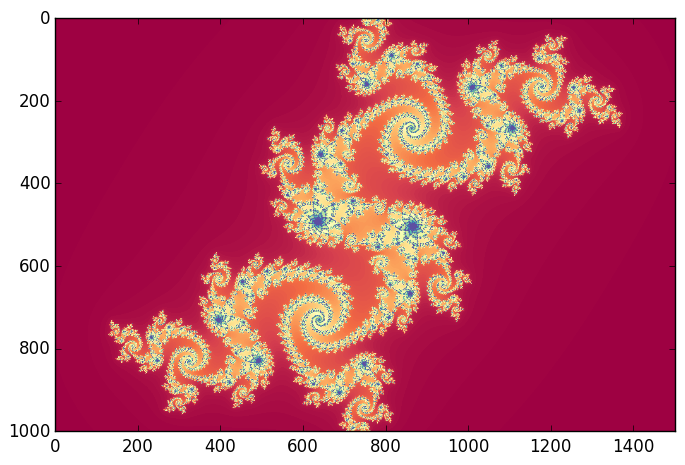
Obviously fractals aren't cool until we see them!
vars plot this 2d array. We still need to specify what color to use for each value, but we'll just var the plotter take over that.
using PyPlot; imshow(arr2d, cmap="Spectral");